
Dashboard
The Dashboard is a great place to go if you are looking for information relating to your Swift Digital account - from tracking your database, and managing your publications to reviewing your expenditure. It is broken up into four unique sections that each give detailed and specific information.
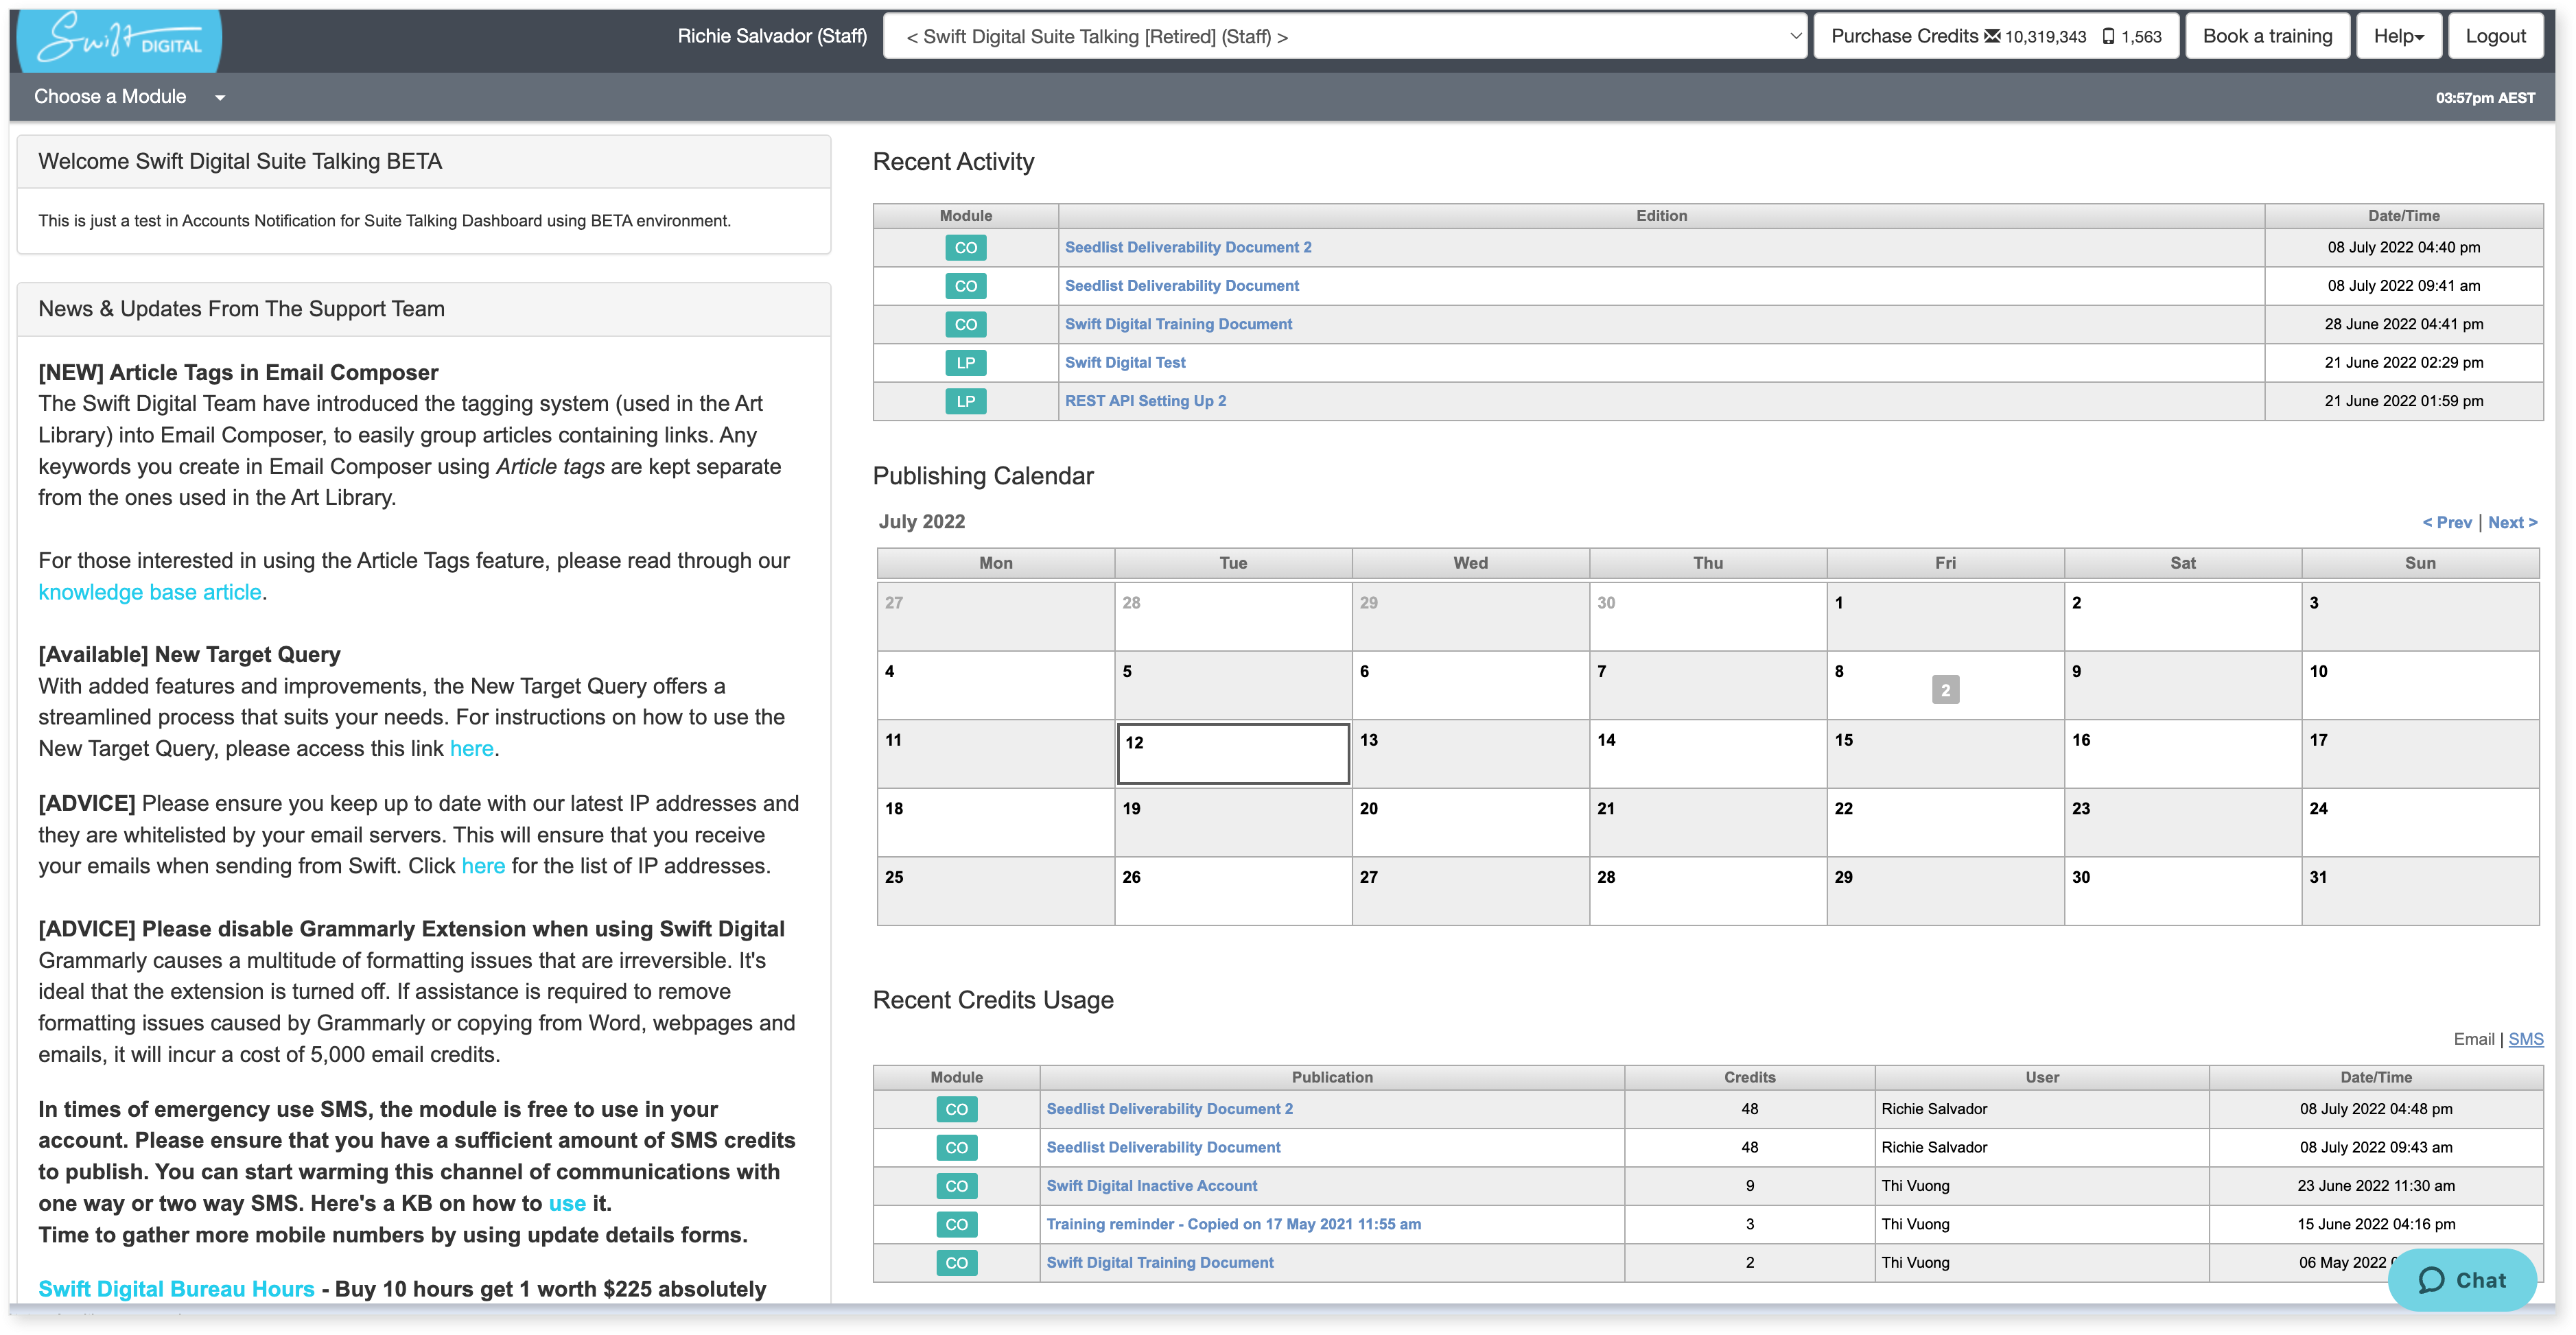
Recent Activity
The recent activity section shows the documents that were recently edited and when they were edited. This lets you easily jump back into an unpublished document to edit or access reports for published documents.
If your account has multiple users this section will help in monitoring their activities by giving an indication of when they last worked on something.
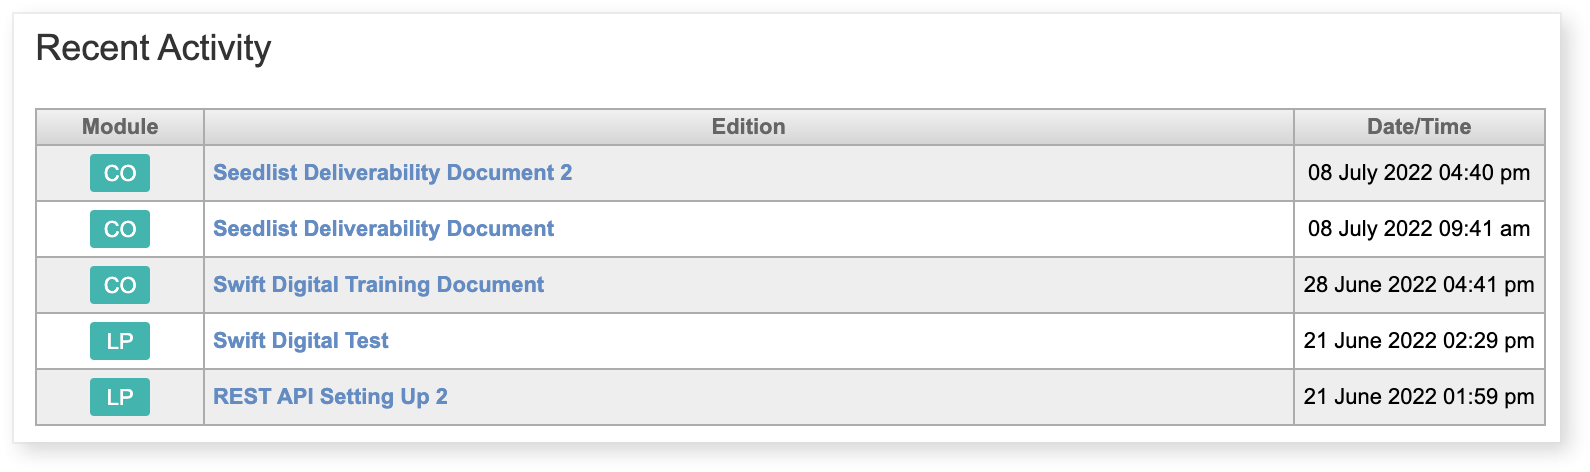
Publishing Calendar
Shows all current, future, and previous publications. Selecting a date that contains a publication/s (past or future) will display a list below the calendar.
The list of publications that displayed below your calendar will provide information on the publication including the date it was published, who published it, and what kind of file it was. Selecting the title of the list item will link you to the publication report.
Note: Selecting the "Prev" and "Next" links will scroll through the calendar by month.
Recent Credits Usage
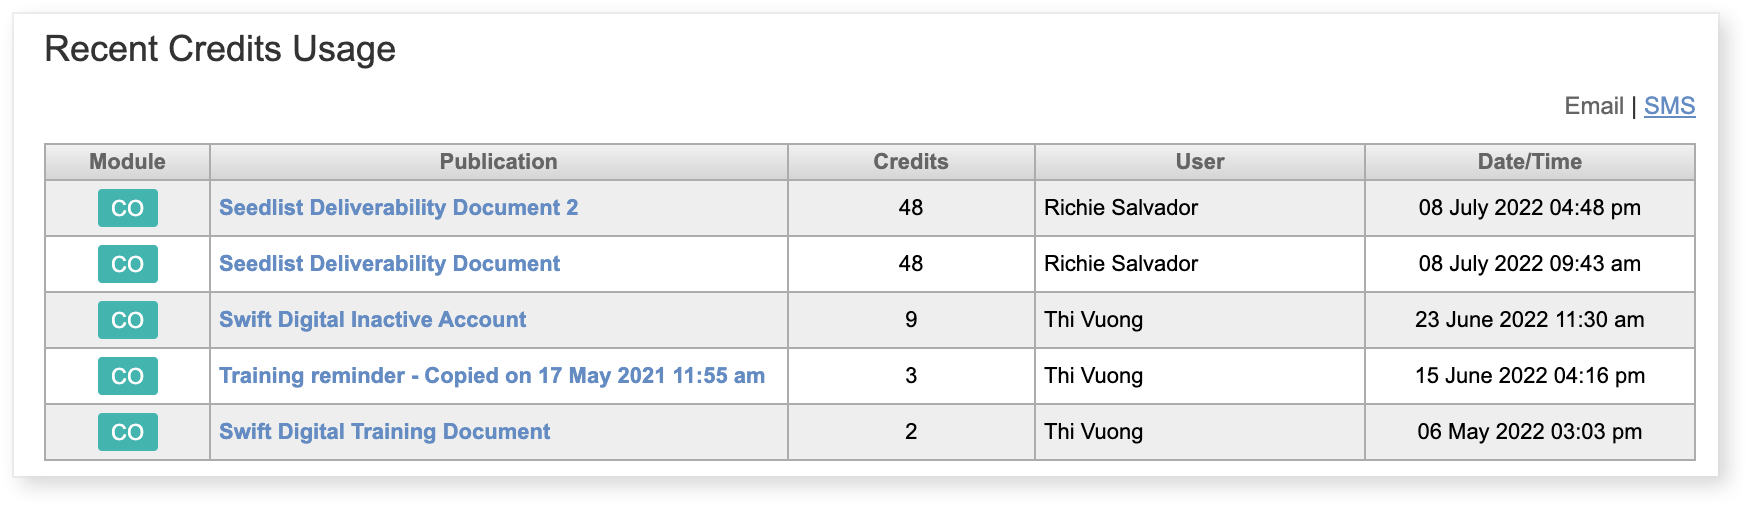
Lets you see how many Email or SMS credits were used on a publication, who published it and when it was published. Clicking 'view more' takes you to the credit logs where you can view all logs of credits spent for your account.
Subscribers Growth Rate
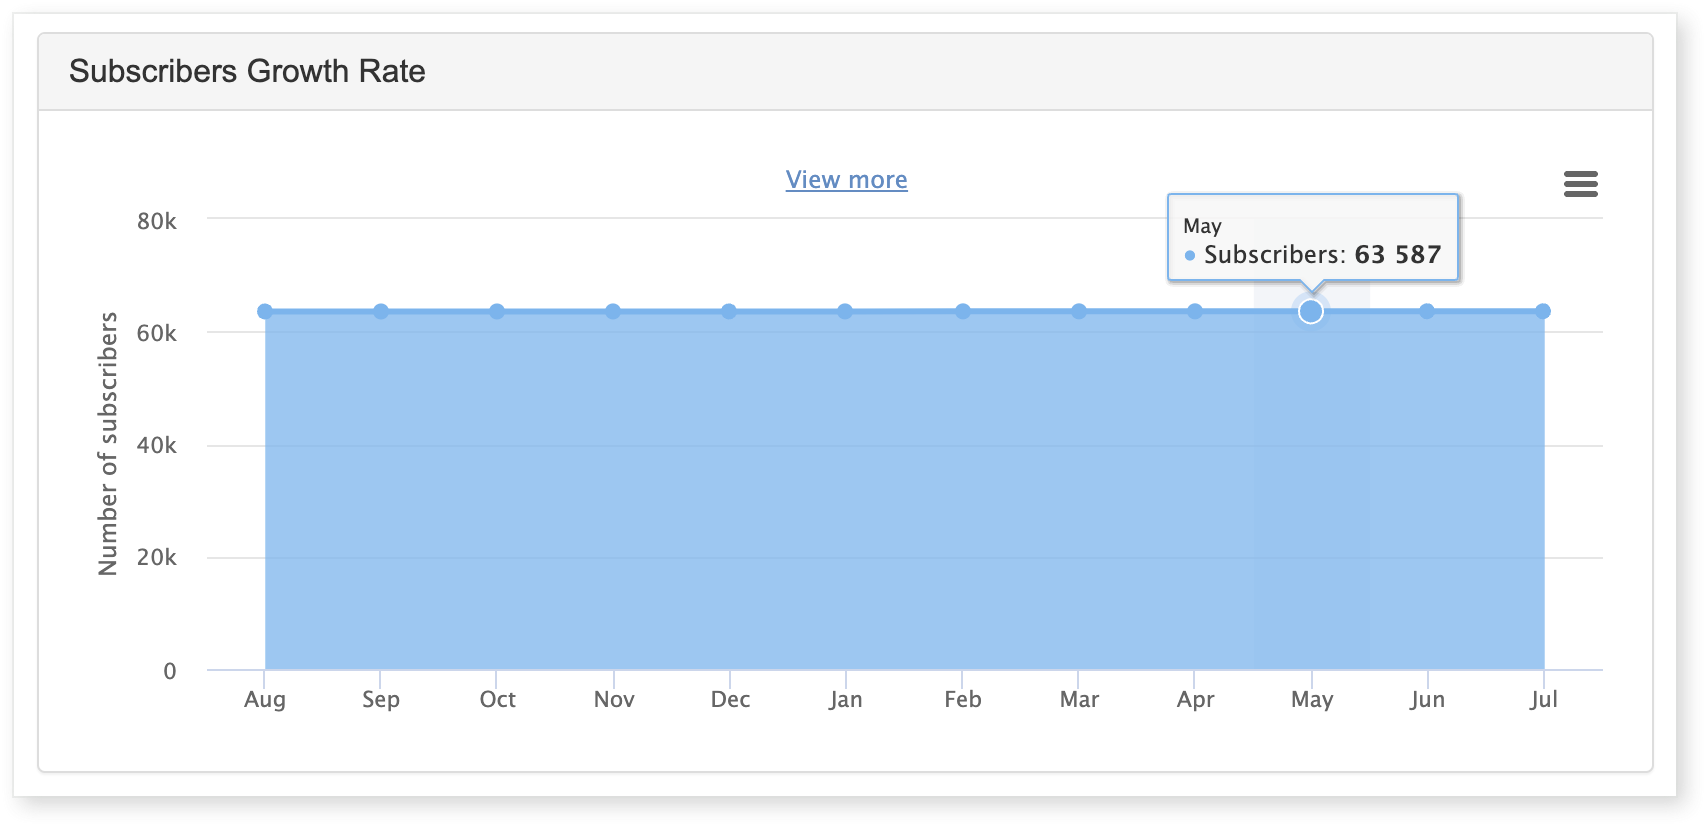
The Subscribers Growth Rate shows a graph with the number of total subscribers. As time passes you can see how your Mail House is growing based on this graph. Keep in mind the blue line indicates the total number of contacts, these could include unsubscribers or bounced emails (email addresses not included in your total sendable amount).
Clicking on the "View more" button will display detailed graphs, outlining Total Mail House Contact, Total Subscribers, Total Unsubscribers, and Total Hard Bounces. This section contains two line graphs Cumulative and Non-Cumulative.
Non-cumulative is great for tracking the different subscriber interactions month by month or year by year (short term) whereas Cumulative will help in tracking the growth of your subscribers over time (long term).
Keeping track of your Mail House growth gives you a snapshot of how well your publications are doing. If you are getting subscribers then it is generally an indication that your publication is doing well.
News & Updates From The Support Team
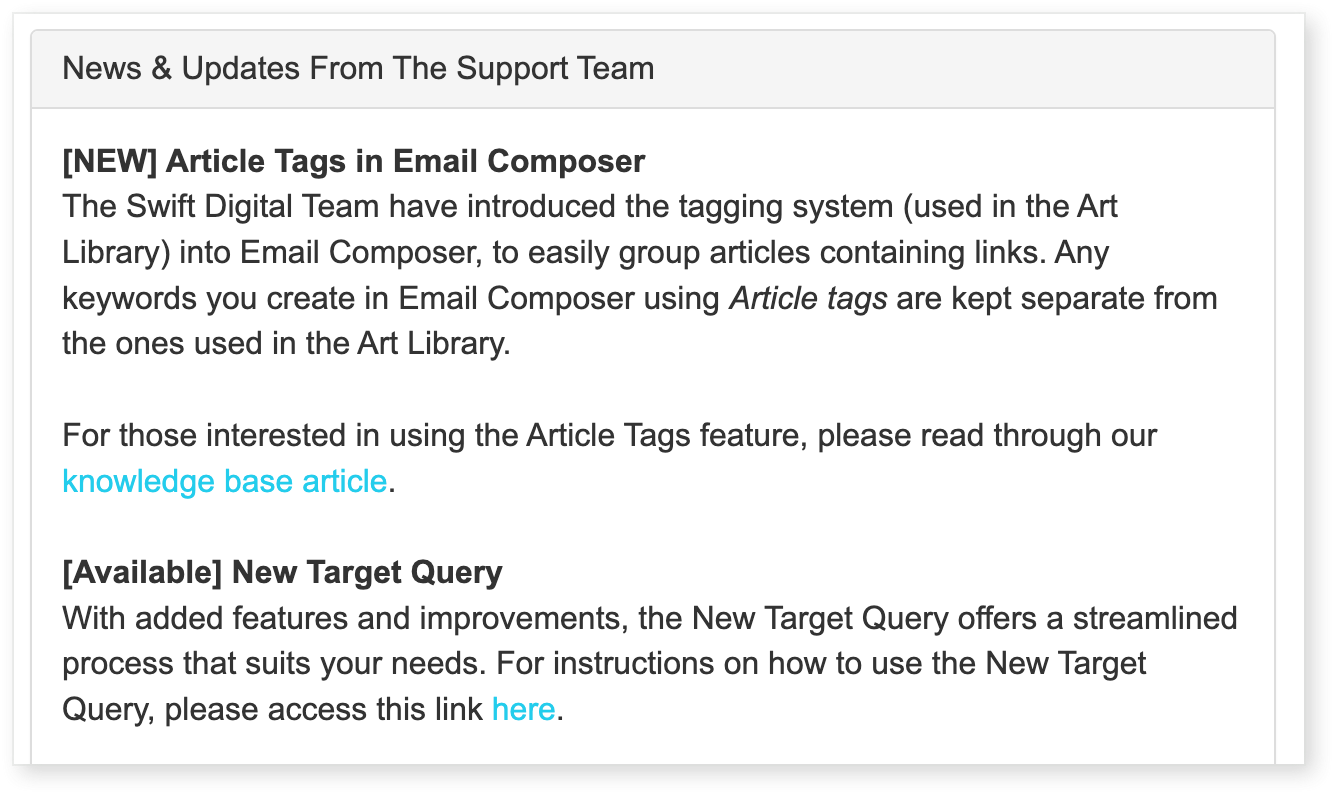
This section is updated regularly by the Swift Digital Support Team to broadcast any updates and improvements to the Suite, maintenance warnings, and general news. Please utilise this area to keep up to date with our team.
0 Comments